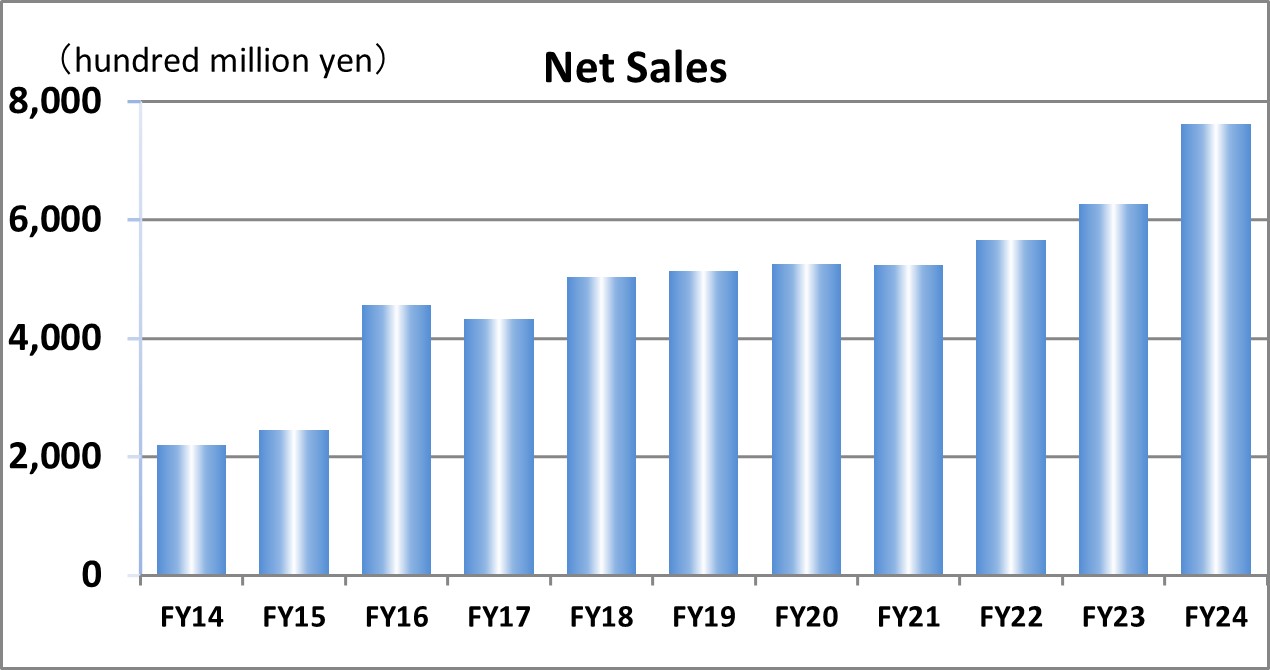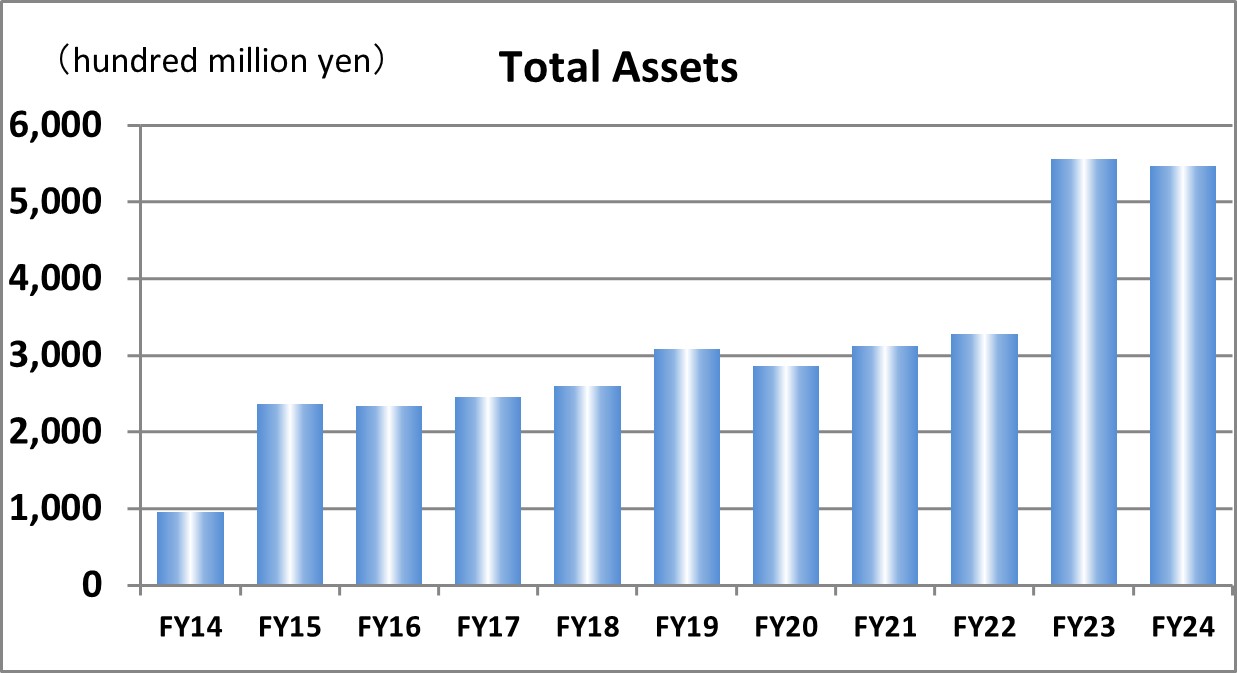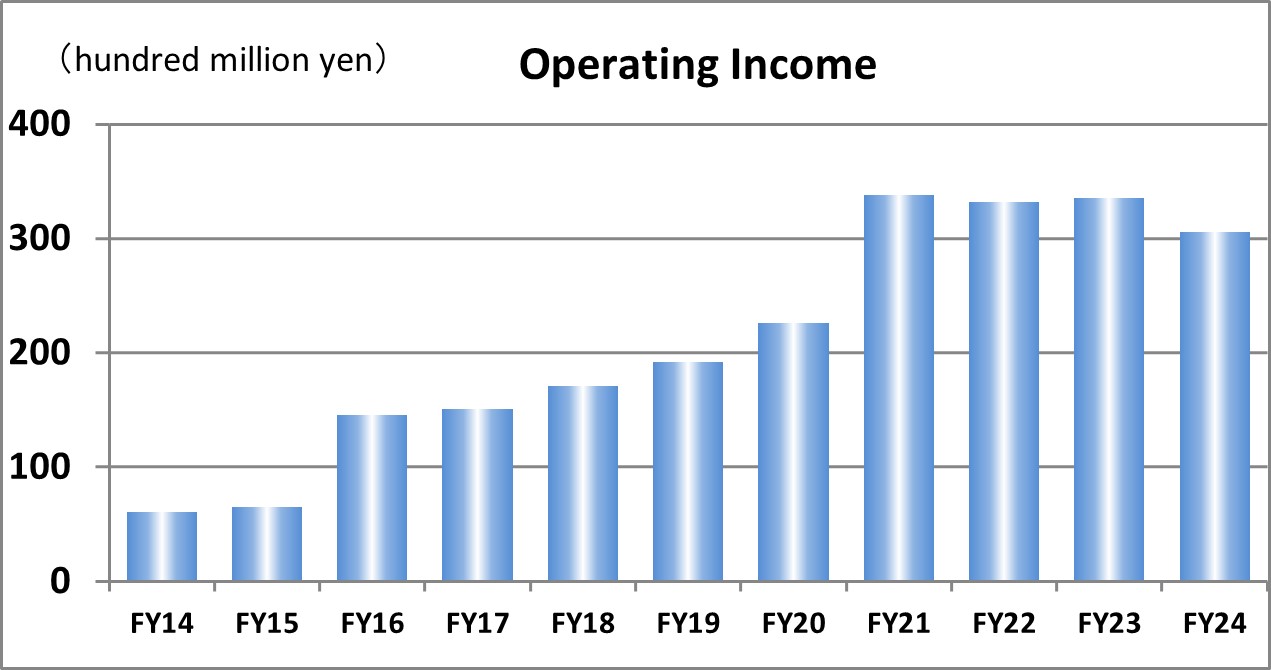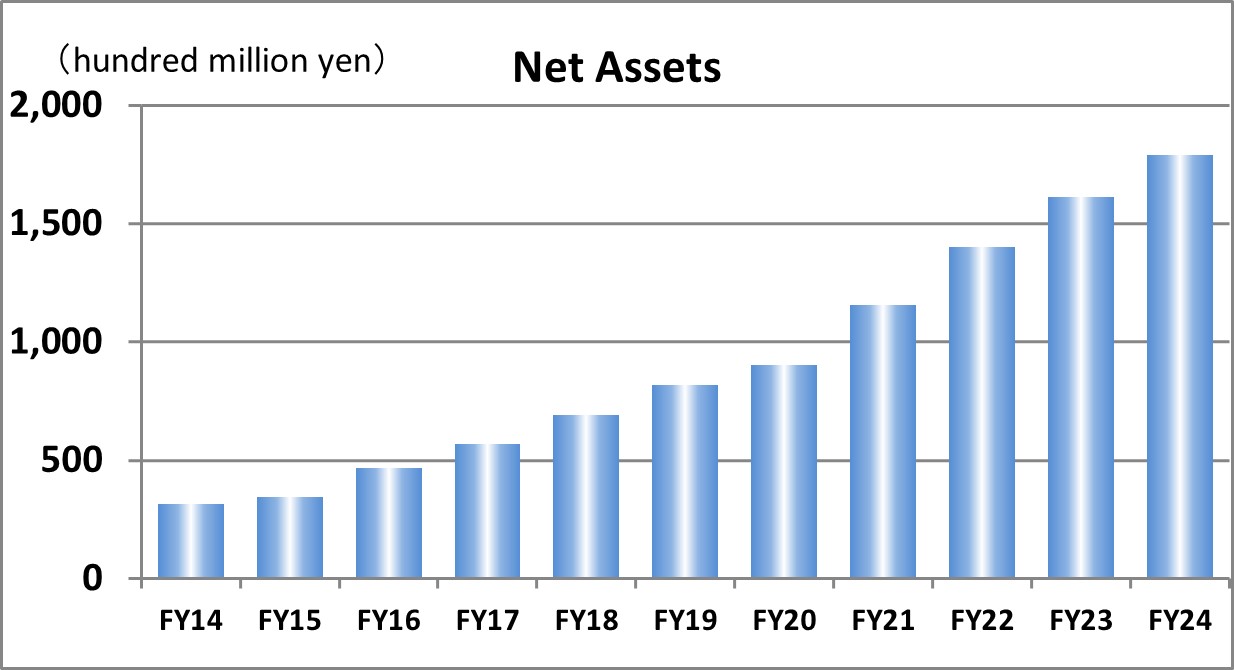

(Amounts are rounded down to the nearest million yen)
| FY2014 | FY2015 | FY2016 | FY2017 | FY2018 | FY2019 | FY2020 | FY2021 | FY2022 | FY2023 | FY2024 | |
|---|---|---|---|---|---|---|---|---|---|---|---|
| Net Sales | 218,402 | 244,067 | 454,842 | 432,064 | 501,890 | 513,057 | 523,968 | 523,327 | 564,989 | 626,181 | 761,301 |
| Operating Income | 6,105 | 6,472 | 14,593 | 15,091 | 17,044 | 19,212 | 22,582 | 33,826 | 33,166 | 33,572 | 30,560 |
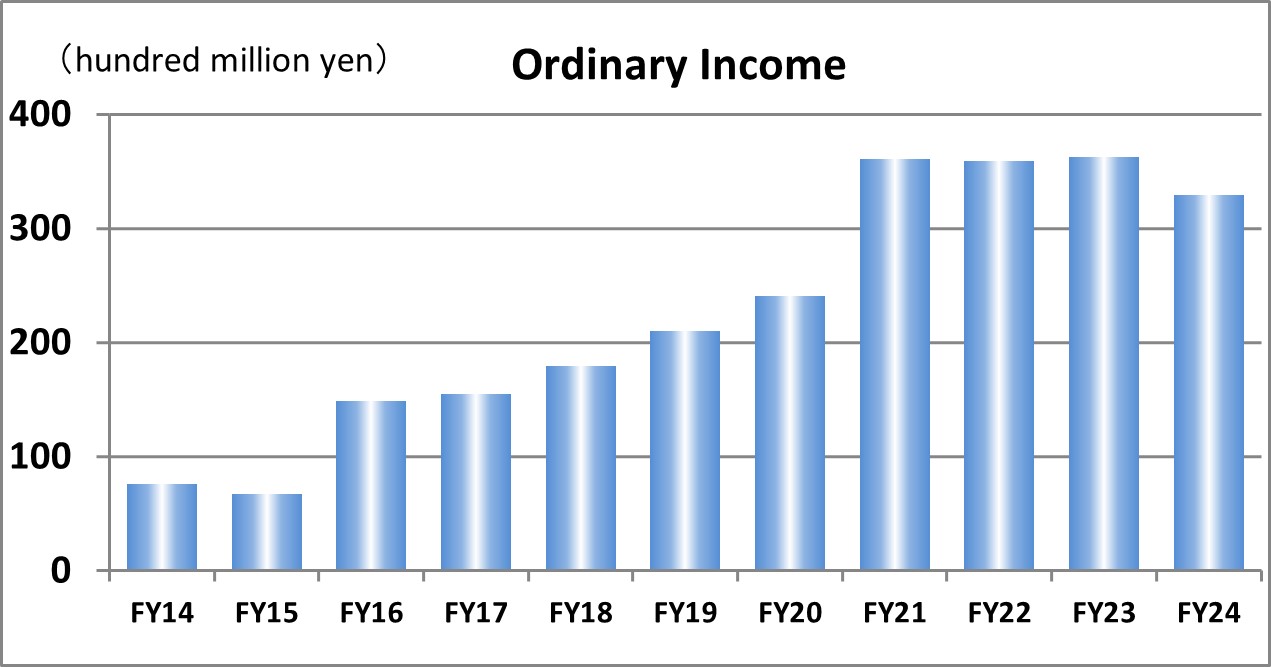
| Ordinary Income | 7,632 | 6,736 | 14,892 | 15,479 | 17,935 | 21,046 | 24,133 | 36,137 | 35,890 | 36,246 | 32,937 |
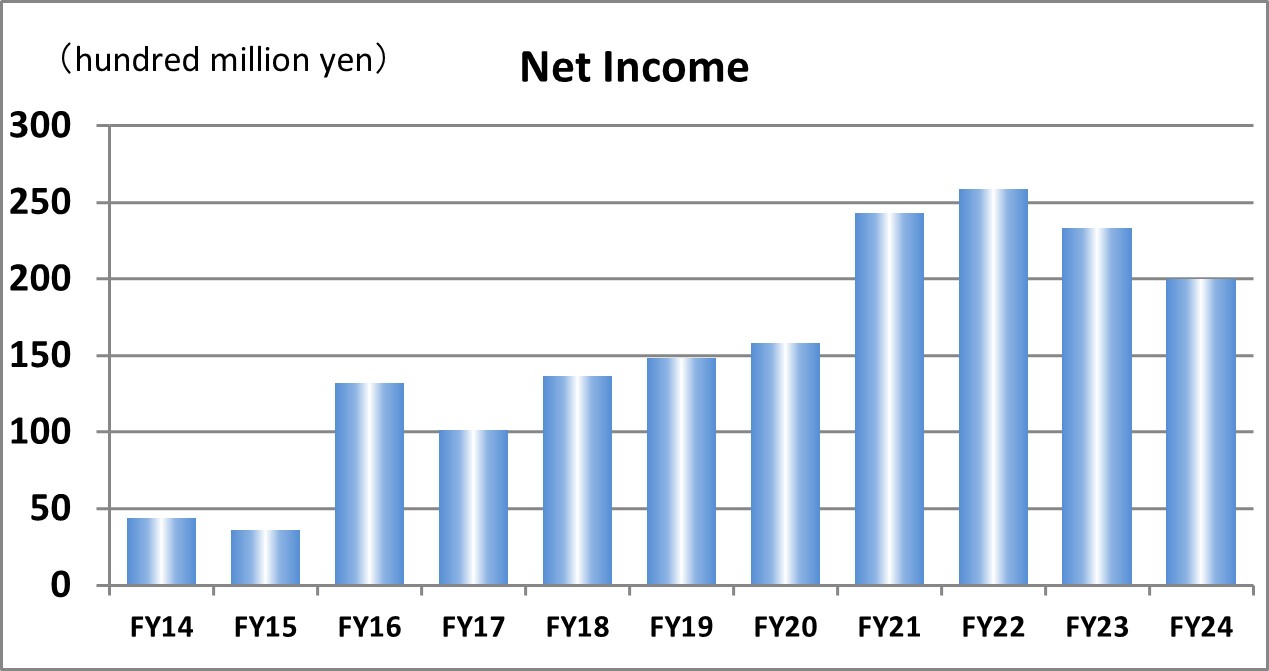
| Net Income | 4,394 | 3,578 | 13,226 | 10,158 | 13,634 | 14,817 | 15,826 | 24,317 | 25,862 | 23,315 | 19,979 |
| Total Assets | 94,650 | 236,104 | 233,434 | 245,467 | 259,756 | 307,735 | 286,162 | 311,418 | 326,952 | 555,905 | 547,142 |
| Net Assets | 31,530 | 34,357 | 46,844 | 56,855 | 69,019 | 81,608 | 90,183 | 115,530 | 140,101 | 161,056 | 178,920 |
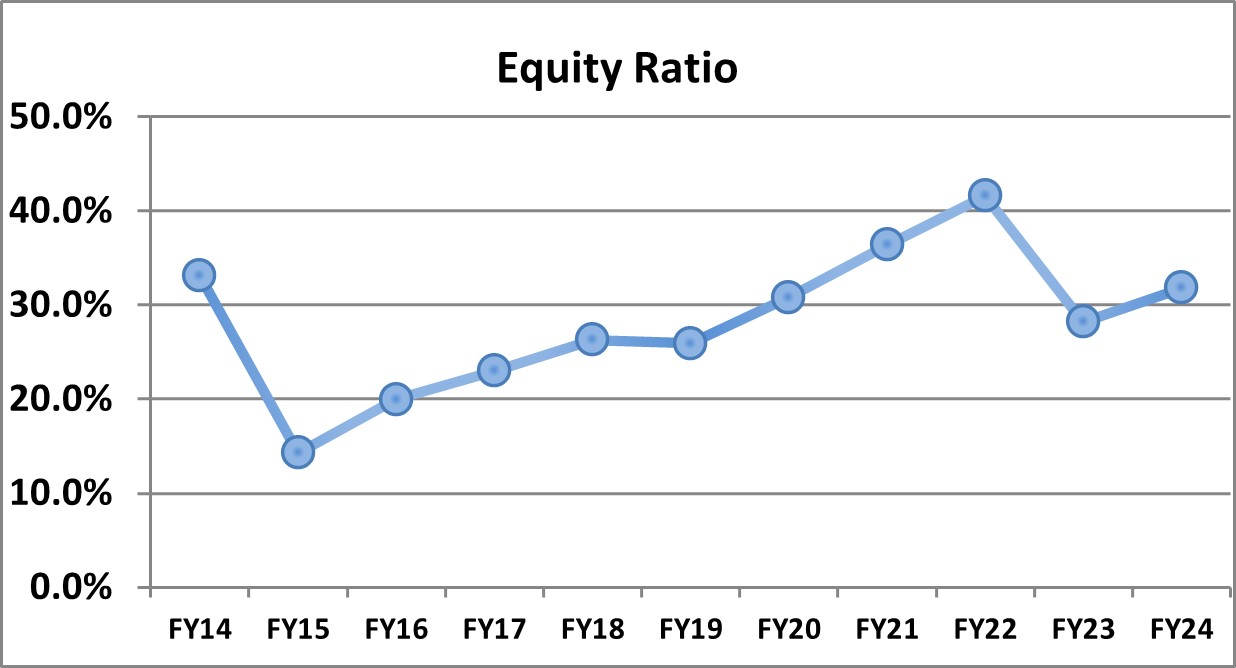
| Equity Ratio | 33.1% | 14.3% | 20.0% | 23.0% | 26.3% | 25.9% | 30.8% | 36.4% | 41.6% | 28.2% | 31.8% |
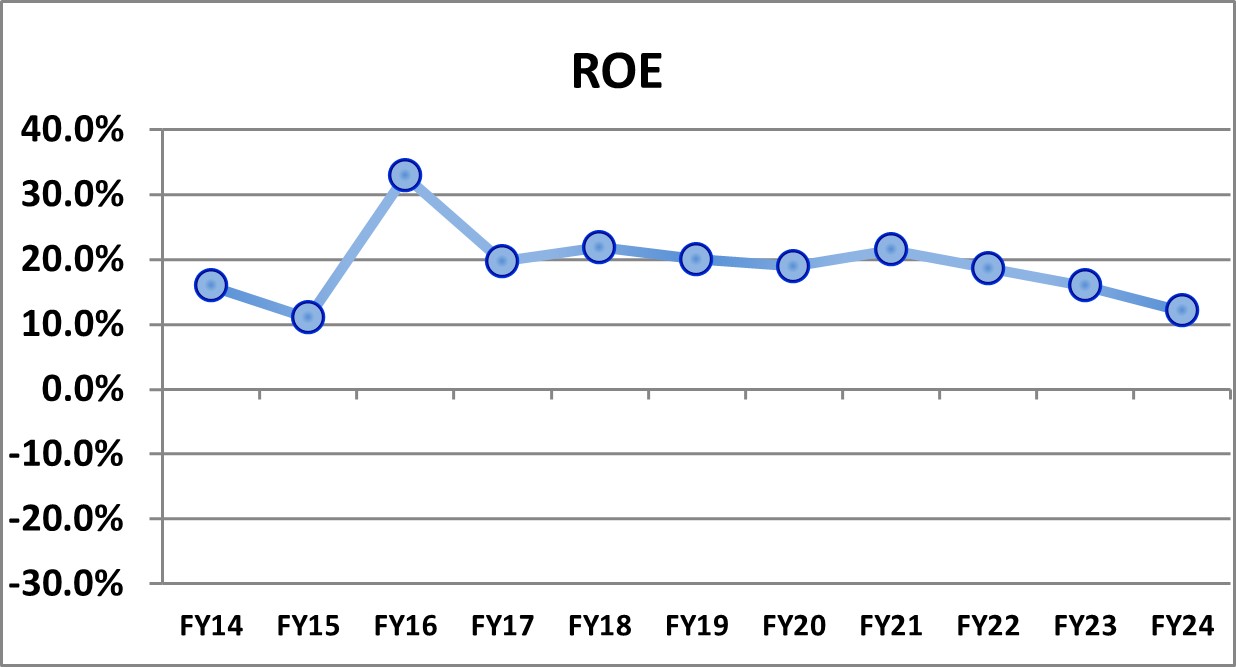
| ROE | 15.9% | 11.0% | 32.9% | 19.7% | 21.9% | 20.0% | 18.9% | 21.5% | 18.6% | 15.9% | 12.1% |
Notes: ITX Corp. was acquired by Nojima Corp. (hereafter, the Company) in March 2015 and included in the consolidation,
thereafter. Only B/S items are included in the figures for FY2014.
Nifty Corp. was acquired by the Company in April 2017 and included in the consolidation, thereafter
Courts Asia Ltd. was acquired by the Company in February 2019 and included in the consolidation,
thereafter. (Deemed acquisition date March 31, 2019) Only B/S items are included in the figures for FY2018.